Objectives
- Identify neighborhood hotspots and cooling opportunities.
- Build a reproducible, low-cost sensing platform and open dataset.
- Share actionable recommendations with community.
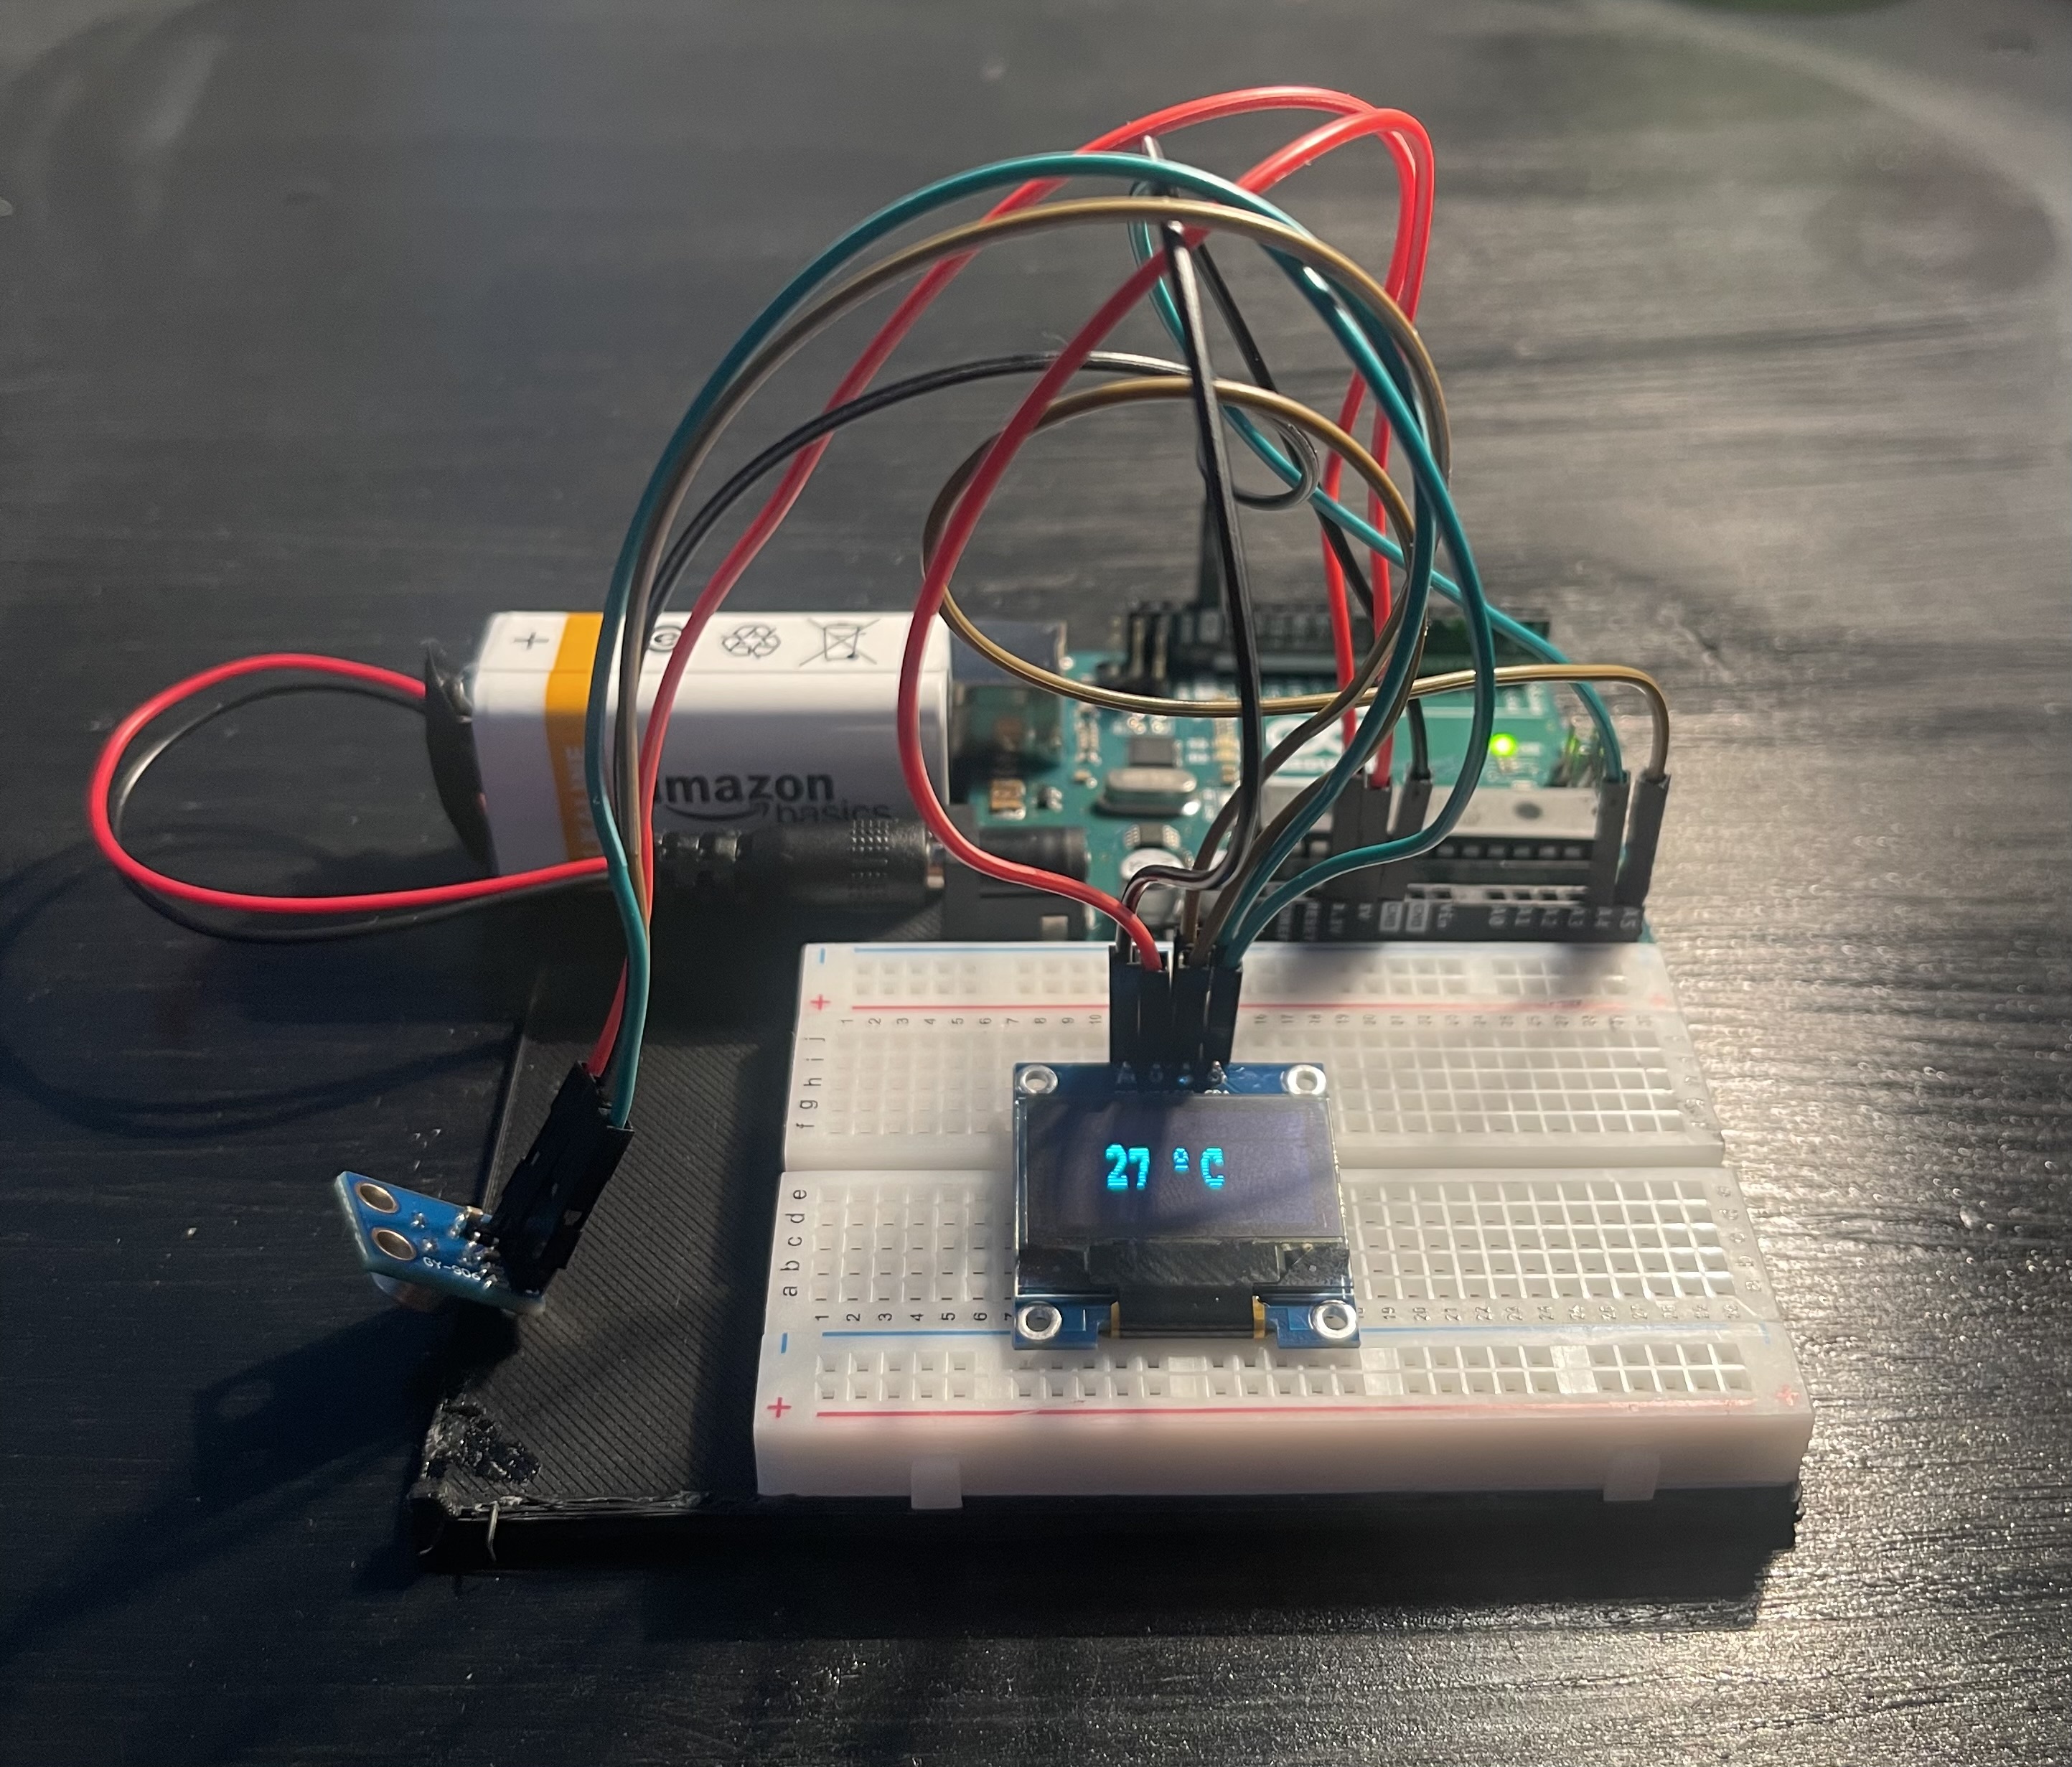
I engineered a portable IR sensing rig with an Arduino, measured surface temperatures at 10 mapped locations, and analyzed how materials amplify heat versus ambient air at 8:00 AM, 2:00 PM, and 8:00 PM.
Prefer the cloud? Open Google Sheets
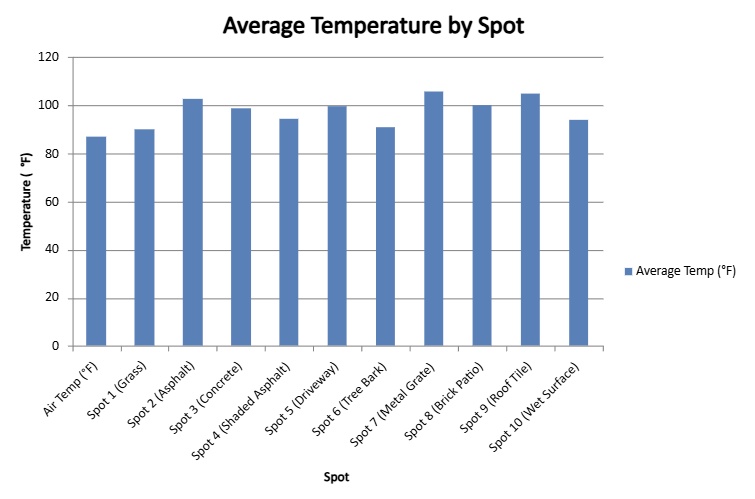
This project quantifies micro-scale Urban Heat Island effects by comparing air temperature with surface temperatures across diverse materials: grass, asphalt, concrete, shaded asphalt, driveway, tree bark, metal grate, brick patio, roof tile, and wet surface.
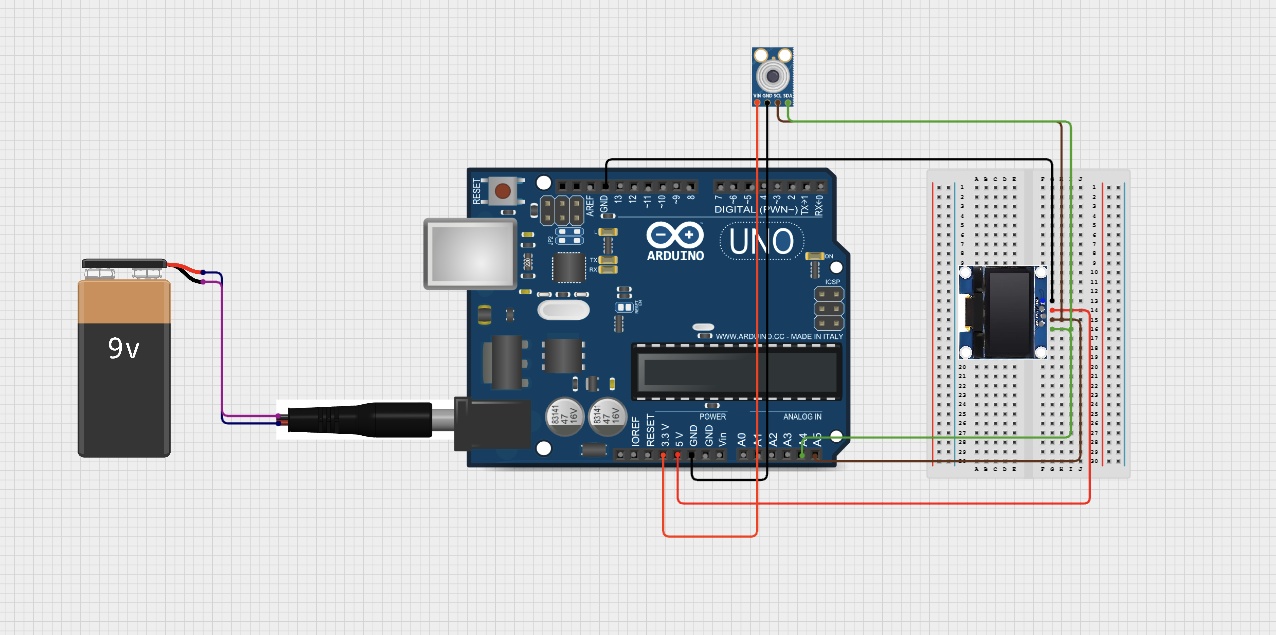
I²C: MLX90614 + OLED share SDA→A4, SCL→A5. Power VCC→5V (or 3.3V per module), GND→GND.
Power: 9V via barrel jack to onboard regulator (field use), USB for bench testing.
All components are mounted on a 3D-printed base using super glue for clean routing and serviceability. Sensor lens faces forward without obstruction.
Two summers (June–July), 16 weeks, 3 timepoints/day across 10 spots. Includes per-spot charts, combined comparison, summary statistics, and material-group averages.
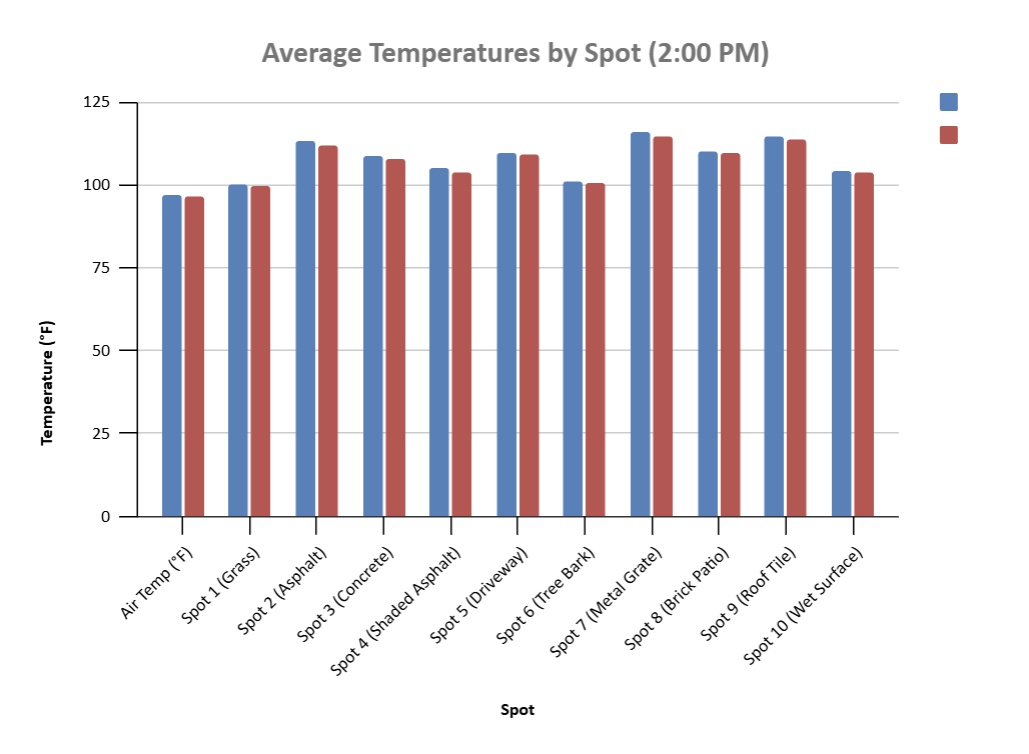
Based on the 2:00 PM averages in the Seasonal Comparison chart, 2025 temperatures trend slightly lower than 2024 across most spots. All narrative and takeaways below reflect this updated finding.
At peak (2 PM), materials typically rank: metal grate ≈ roof tile ≥ asphalt ≥ brick patio ≥ driveway ≥ concrete ≥ shaded asphalt ≥ tree bark ≥ grass ≥ wet surface. The exact order varies day-to-day, but metals and dark roofs consistently occupy the top tier.
Shaded asphalt runs about 5–10 °F cooler than sun-exposed asphalt at 2 PM, aligning with expected reductions from radiative shading. Morning and evening gaps narrow to ~2–5 °F.
Grass and tree bark remain the most stable and coolest surfaces, typically 1–6 °F above air even at peak heat, indicating lower heat capacity/retention compared to built materials.
Across all surfaces, temperatures rise from morning to afternoon and partially recover by evening. The asphalt and roof tile curves exhibit the largest midday spikes (+12–20 °F over air), while vegetation shows the smallest amplitude (+1–6 °F).
Metal grates show the most variability under clear skies (specular heating + airflow), occasionally exceeding typical pavement peaks. Wet surfaces track closer to air temperature, especially post-irrigation or rainfall.
This project focused on mechanical engineering and environmental tech. I designed and built the device, conducted the study, and created the analysis and this website. All source files and data are available on request.
Send me a message directly from this page.